BrainMap ICA
Recently, the BrainMap project has extended its focus from paradigm-based meta-analyses to investigations of large-scale, whole-database data mining. Two studies have been published that applied a multivariate analysis technique (independent component analysis) on the data archived in the BrainMap task database:
- Smith et al., 2009:
Neural connections, providing the substrate for functional networks, exist whether or not they are functionally active at any given moment. However, it is not known to what extent brain regions are continuously interacting when the brain is ‘‘at rest.’’ In this work, we identify the major explicit activation networks by carrying out an image-based activation network analysis of thousands of separate activation maps derived from the BrainMap database of functional imaging studies, involving nearly 30,000 human subjects. Independently, we extract the major covarying networks in the resting brain, as imaged with functional magnetic resonance imaging in 36 subjects at rest. The sets of major brain networks, and their decompositions into subnetworks, show close correspondence between the independent analyses of resting and activation brain dynamics. We conclude that the full repertoire of functional networks utilized by the brain in action is continuously and dynamically ‘‘active’’ even when at ‘‘rest.’’ - Laird et al., 2011:
An increasingly large number of neuroimaging studies have investigated functionally connected networks during rest, providing insight into human brain architecture. Assessment of the functional qualities of resting state networks has been limited by the task-independent state, which results in an inability to relate these networks to specific mental functions. However, it was recently demonstrated that similar brain networks can be extracted from resting state data and data extracted from thousands of task-based neuroimaging experiments archived in the BrainMap database. Here, we present a full functional explication of these intrinsic connectivity networks at a standard low order decomposition using a neuroinformatics approach based on the BrainMap behavioral taxonomy, as well as a stratified, data-driven ordering of cognitive processes. Our results serve as a resource for functional interpretations of brain networks in resting state studies and future investigations into mental operations and the tasks that drive them.
- Figure 1 - BrainMap ICA data processing pipeline
- Figure 2 - Intrinsic connectivity networks
- Figure 3 - Selection of critical metadata fields
- Figure 4 - Metadata dendrogram (high res version)
- Figure 5 - Dendrogram of network-driven clustering analysis
- Figure 6 - Metadata heat map (high res version)
Image and Metadata Files
The network images and associated metadata matrices generated in this study can be downloaded below to aid interpretation of the functional significance of future resting state results. In addition, they may be useful as masks for seeding specific a priori cortical regions or networks of interest in prospective neuroimaging studies or as a technique for circumventing the inherent problems associated with double dipping.
- Image Files (20 ICA Components) - .zip, 2 MB
- Anatomical Template (Talairach space) - .nii, 8.2 MB
- Metadata Matrices (12 BrainMap Fields) - .zip, 40 kB
- Ray et al., 2013:
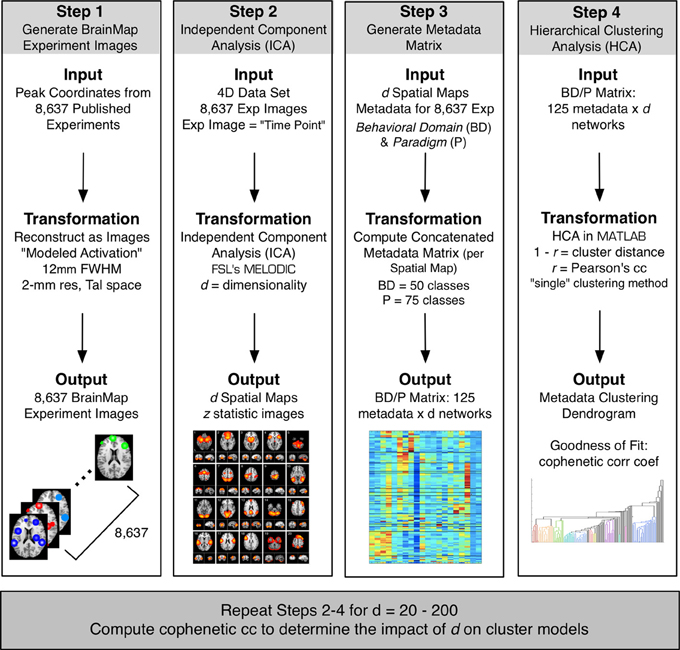
Independent component analysis (ICA) has become a widely used method for extracting functional networks in the brain during rest and task. Historically, preferred ICA dimensionality has widely varied within the neuroimaging community, but typically varies between 20 and 100 components. This can be problematic when comparing results across multiple studies because of the impact ICA dimensionality has on the topology of its resultant components. Recent studies have demonstrated that ICA can be applied to peak activation coordinates archived in a large neuroimaging database (i.e., BrainMap Database) to yield whole-brain task-based co-activation networks. A strength of applying ICA to BrainMap data is that the vast amount of metadata in BrainMap can be used to quantitatively assess tasks and cognitive processes contributing to each component. In this study, we investigated the effect of model order on the distribution of functional properties across networks as a method for identifying the most informative decompositions of BrainMap-based ICA components. Our findings suggest dimensionality of 20 for low model order ICA to examine large-scale brain networks, and dimensionality of 70 to provide insight into how large-scale networks fractionate into sub-networks. We also provide a functional and organizational assessment of visual, motor, emotion, and interoceptive task co-activation networks as they fractionate from low to high model-orders.
- Figure 1 - The BrainMap ICA processing pipeline
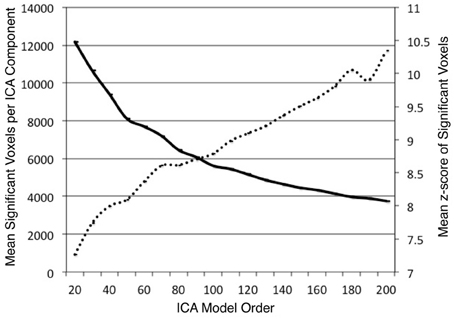
- Figure 2 - Mean number and z-score of component voxels
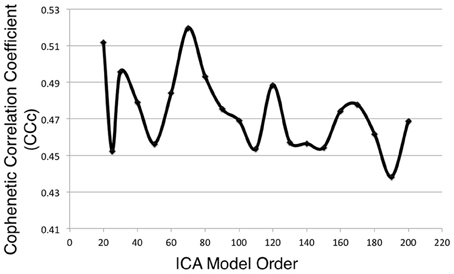
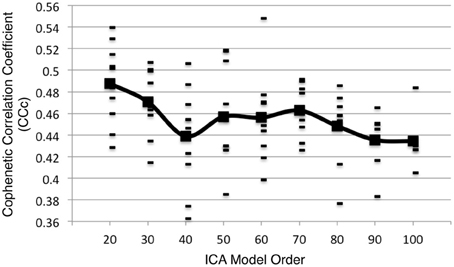
- Figure 3 - Cophenetic correlation coefficient values
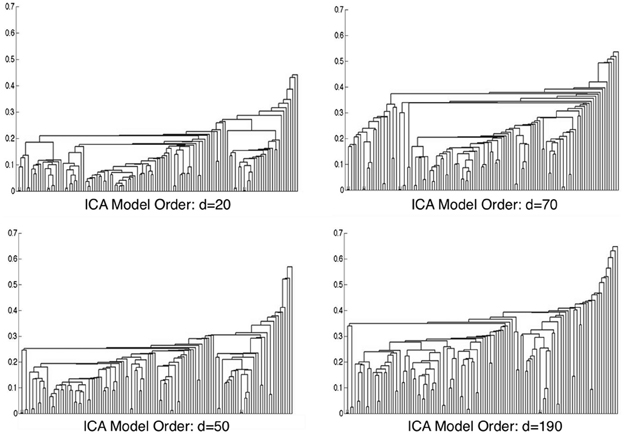
- Figure 4 - Hierarchical clustering dendrograms
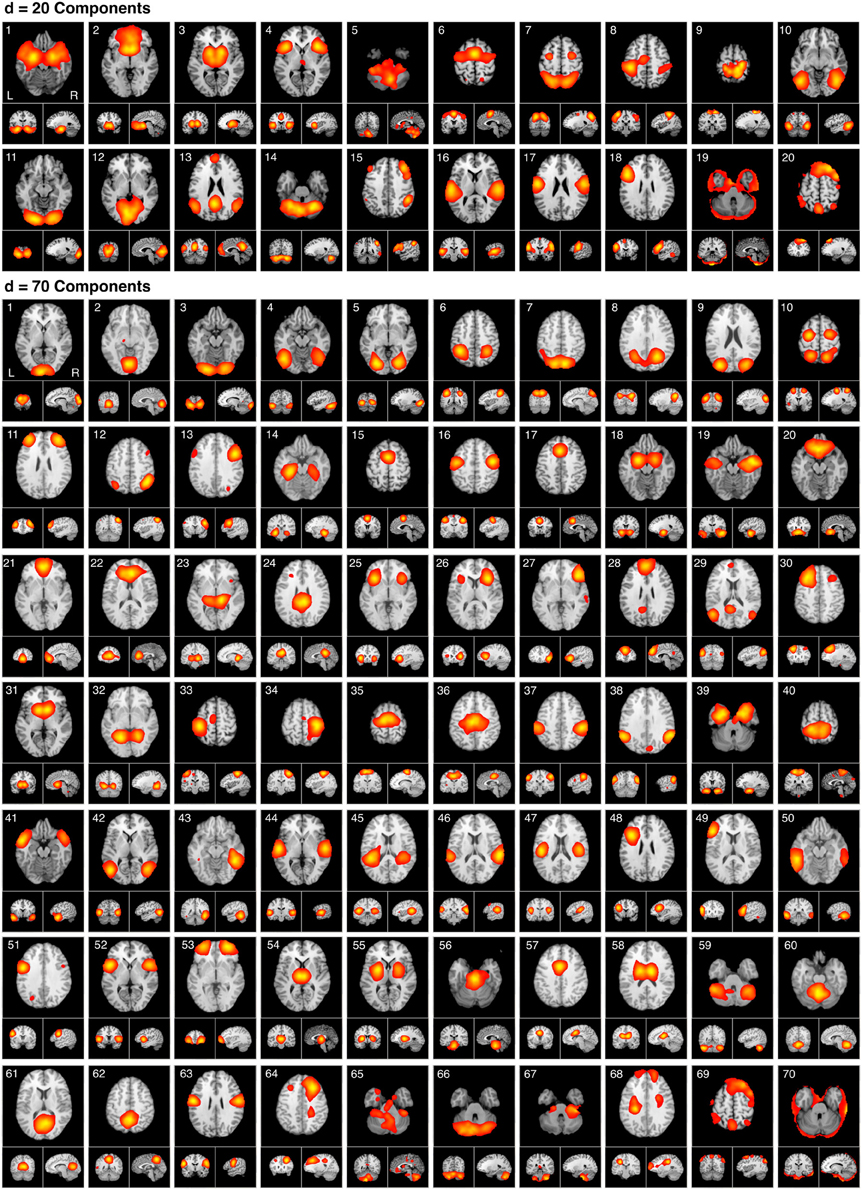
- Figure 5 - 20 and 70 component solutions
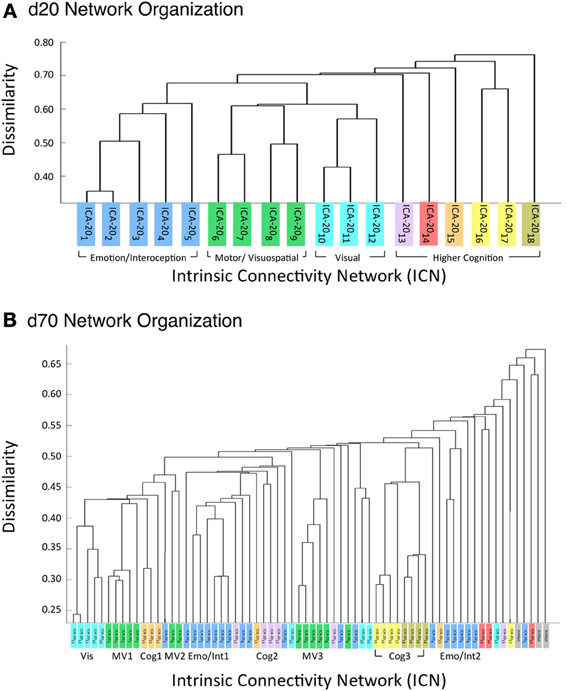
- Figure 6 - HCA of BrainMap-based ICNs at d = 20 and d = 70
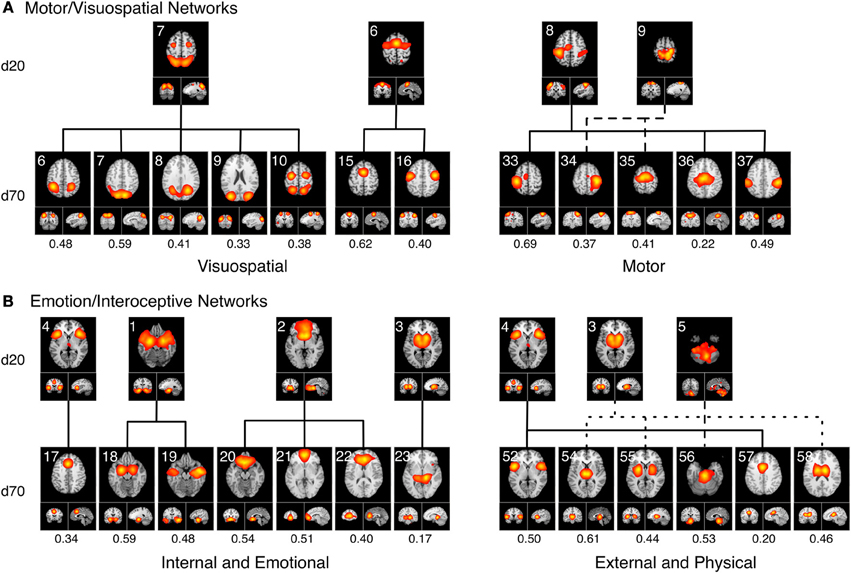
- Figure 7 - Fractionation of BrainMap-based ICNs
- Figure 8 - Additional analyses
Image and Metadata files
- Image Files (70 ICA Components) - .zip, 3.9MB
- Metadata Matrices (2 BrainMap Fields) - .txt, 100kB
- Vanasse et al., 2018: [Complete Citation]
As with BrainMap’s functional database, the BrainMap VBM database can also be synthesized en masse (i.e., with sparse filtrations in analysis regarding predefined experimental categories or spatially confined ROIs). Here, we illustrate a data-mining procedure wherein we explore the underlying network structure of 2,002 VBM experiments representing over 53,000 subjects through independent components analysis (ICA). These networks represent transdiagnostic, inter-experimental networks of structural covariance. In addition, to reduce data-redundancy effects inherent to any database, we demonstrate two data-filtering approaches (Paper vs. Experiment-filtered) that proved helpful. We apply hierarchical clustering analysis (HCA) to measure network- and disease-specificity. Finally, these networks were compared to an Activation Likelihood Estimation (ALE) image of experiments measuring age-related atrophy — which was also extracted from BrainMap VBM.
- Paper-level d20 ICN images
- Experiment-filtered d20 ICN images
- Age-associated ALE unthresholded and thresholded using cluster-level FWE 0.05 and 1000 permutations
The 20- and 70-dimensional ICA BrainMap and resting state components from this study can be downloaded from the FMRIB's website, courtesy of Steve Smith.
Copyright © 2003 Research Imaging Institute. All rights reserved.


